Page 4 of 6 FirstFirst 123456 LastLast
Results 76 to 100 of 141
  1. #76
    e^(i*pi) + 1 = 0 MannyIsGod's Avatar
    My Team
    San Antonio Spurs
    Join Date
    Mar 2003
    Post Count
    57,479
    For what I have laid out, I am not attempting to quantify CO2. I am only showing that solar forcing is more than just the direct solar forcing. I do not accept the levels the prominent experts claim CO2 adds in radiative forcing. Not only are the high numbers used, but there is a wide range of numbers out there. A range of 9% to 26% of the greenhouse effect by CO2 is a pretty big range. Most certainly shows lack of certainty. The IPCC and other alarmists use the high percentage. I think it's only about 10% to 12%. , it may be even lower than the 9%. The 26% is simply insane.
    Based on what, WC? Other than your own conformation bias, what makes qualified to say what the ranges should be? Where is your work? Show your calculations.


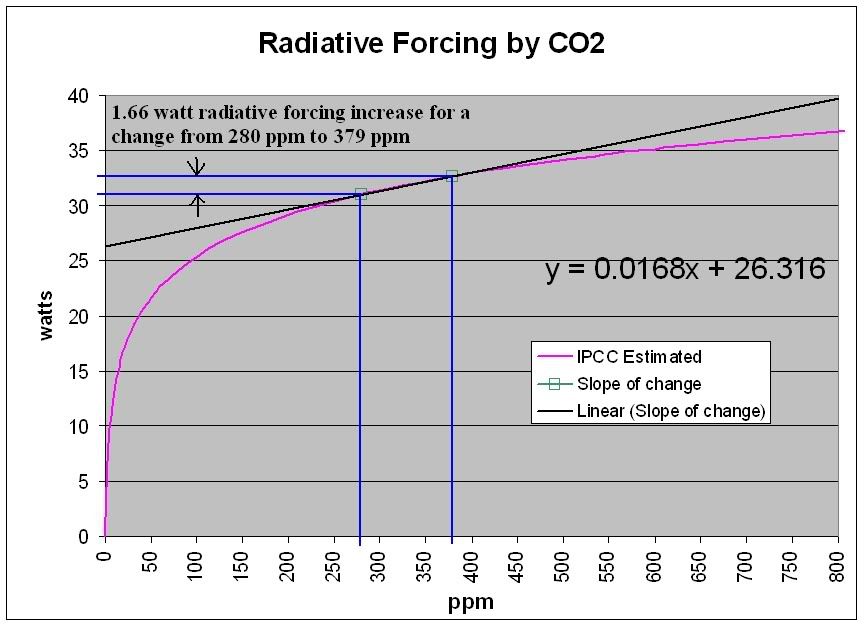
    Now if I go by what the IPCC says, I get this from excel:


    I reconstructed that using two reference points supplied by the IPCC AR4, and it shows about a 33 watt/square meter radiative forcing of CO2 total at the 2004 timeframe.

    Again, an increase in solar radiation increases the direct and indirect heat. It's not just the 0.12 watts of direct solar heat, but with the added IR emanating from the surface.
    Where does that added IR come from? You don't get to add the energy twice. Obviously the increased radiative forcing from the sun will cause heating at the surface but you don't somehow get to add that twice.

    If I give you 100 dollars and you turn around and spend 50 of that you don't get to say that you got another 50 dollars as change for a total of 150 dollars. That should be incredibly obvious.

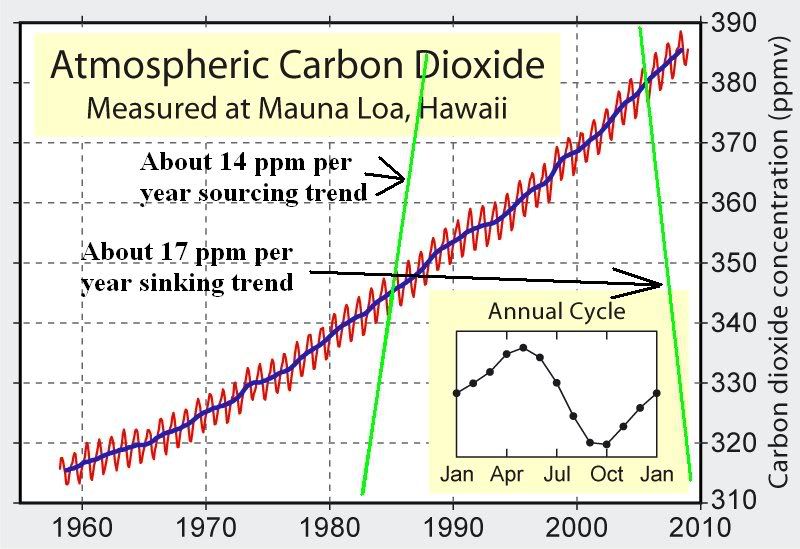
    I have looked at the Keeling curve before. Here is one image I added to in the past:


    If you notice, two trends, one up and one down, that show Co2 changes with warming and cooling. If CO2 drove temperature, then why does CO2 change with the summer/winter temperature changes?
    It goes up and down each year for a very obvious reason. In a few months tell me how many of those green things that tend to use CO2 are still growing at the rate they are now. Given as most of the land - and therefore plant life - lies in the northern hemisphere it should be obvious why there is a seasonal variability.

    The Earth does not have a summer/winter cycle as you're trying to say it does, however. When those CO2 figures drop in the summer of the northern hemisphere, half of the globe is experiencing winter.

    Huh? I never included CO2, but see my above graph.
    He's asking you to do two calculations. One with your figures and one with their CO2 figures and try to see which one replicates the warming. Its the exact same thing I asked you for before because when you come up with a hypothesis it is required that you test it somehow. Seeing as you're arguing over variables in an equation you can easily plug in the other factors of that equation using data from the past and see how your results and the results of scientists who claim CO2 forcing is higher line up with reality.

    The point is that these forcings are EXTREMELY testable. What do you come up with?

    Once again - show your work.

    I am fully aware of this. Please understand, I have done a great deal of reading on the topic. Different gasses in the atmosphere have different sets of frequencies they respond to.

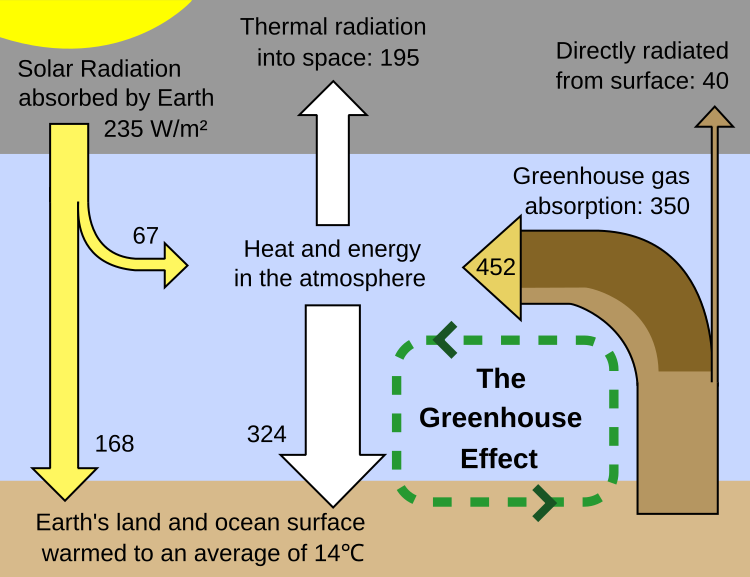
    I am using an accepted greenhouse gas model. I did not make this one up. I added numbers to show the effect of a solar change. The greenhouse effect number is total effect of all atmospheric gasses. The Here is the original:


    It is created from the data in an article led Earth’s Annual Global Mean Energy Budget. This article has another representation of the greenhouse effect, figure 7.

    Please also notice that in the Abstract of the article gives a CO2 value of 32 watts/square meter.

    Trust one or the other? That would be because one or the other is wrong, and how do you really determine which? I have decided that because both solar and black carbon forcing are far greater than stated by the alarmists, that the forcing CO2 is said to have is incorrectly high. For my conclusion to be incorrect, then even the lowest accepted solar increases since then maunder Minima would have to be wrong.
    Once again, show your work.

    I know this much as a certainty. The sun provides the earth with more than 99.99% of our heat. The heat collected by the earth surface is radiated back in mostly infrared radiation. The upward when lag is considered is equal to the downward energy. That said, the sun is the source for the energy that produces the greenhouse effect. As this source energy increases, the greenhouse energy returned with the greenhouse effect with no greenhouse gas level change will increase, as the greenhouse effect is a feedback of the original solar energy.

    Bottom line is that the change atmospheric radiative force is proportional to the incoming solar changes. With no solar energy (heat source), there would be no greenhouse effect.

    All these variables keep changing. Climate sensitivity of course will also change with the atmospheric changes. Again, temperature and heat are two different things. Watts is a measurement of energy directly proportional to heat.

    For what? A simple 0.18% increase in solar power will equate to a 0.18% increase in atmospheric radiative forcing? All atmospheric forcing is a feedback of the incoming solar power, therefore, it will be at least nearly proportional to the incoming heat. I'm speaking long term, not short term also.

    I wonder if I miss judged you. Let me ask in a simpler way. Do you agree that atmospheric heat will be proportional to solar heat with all other factors equal, or not?
    Show your work.

  2. #77
    e^(i*pi) + 1 = 0 MannyIsGod's Avatar
    My Team
    San Antonio Spurs
    Join Date
    Mar 2003
    Post Count
    57,479
    I was going to just wait for you to respond as to why you found it interesting but the fact is that you likely won't respond so I'll just move on and tell you why although its interesting its also flawed.

    The synopsis of that study is that it looks at outgoing radiation during periods of increased temps in the tropics. What they found was that when the temps rose in the areas between 20 degrees lat N and 20 degrees lat S there was an increase in outgoing radiation that indicated a low climate sensitivity.

    However, the paper has a few really poor premises. First, the tropics are not the globe. Heat is transported around the world. These periods they studied were basically the positive side of the ENSO cycle or the El Nino phase. As you know, the entire globe's average temp rises during an El Nino year so you can't assume that while the tropics are losing a good deal of energy back out to space the entire globe is.

    When you account for the entire globe, all of a sudden the results are completely different.

    Two papers that addressed this:

    http://www.agu.org/pubs/crossref/201...GL042911.shtml
    http://www.agu.org/pubs/crossref/201...GL043051.shtml

    More importantly though (and its so fitting the paper you linked is on Spencer's site considering the recent discussion regarding Spencer's bad model), the results obtained by Lindzen are the results of the data they put in. What I mean by this is that by manipulating the start and end dates of the data you put in, you can get pretty much any result you want to get.

    Its like this, if in an analysis of my checking account I try to figure out how much money I have by ONLY looking at days where I make deposits then I'm not going to get an accurate picture. If I exclude days where I made deposits then I'm going to get a completely different picture as well.

    This selective analysis is quite bogus and when your results don't stack up with all the data then it has no merit.

    http://www.agu.org/pubs/crossref/201...GL042314.shtml

    Interesting indeed.

  3. #78
    Veteran DarrinS's Avatar
    My Team
    San Antonio Spurs
    Join Date
    Jun 2005
    Post Count
    41,654
    What makes it interesting, Darrin?

    Apparently, climate models use a sensitivity value that is too high.

  4. #79
    e^(i*pi) + 1 = 0 MannyIsGod's Avatar
    My Team
    San Antonio Spurs
    Join Date
    Mar 2003
    Post Count
    57,479
    Apparently, climate models use a sensitivity value that is too high.
    So you found it interesting only because the conclusion agreed with what you think? I'm quite shocked by this. I wonder what you'll think of the papers that show why the conclusions reached in that paper are incorrect.

  5. #80
    Retired Ray xrayzebra's Avatar
    My Team
    San Antonio Spurs
    Join Date
    Jul 2003
    Post Count
    9,096
    I think this covers the subject of Fox news pretty well. I can't take credit for thinking
    this up.

    Megyn Kelly
    Martha Maccallum
    Harris Faulkner
    Courtney Friel
    Uma Pemmeraju
    Jane Skinner
    Kimberly Guillfoyle
    Did I mention Courtney Friel
    (Oops, repeat. Hope you don't mind)
    Lis Wiehl
    Rebecca Gomez
    Gretchen Carlson

    Courtney Friel (Darn repeated again. Sorry)
    Laurie Dhue
    Julie Banderas, Ainsley Earhart , Dominica Davis

    And there are probably some missing.

    Why Republican Men Are So Much Happier!
    ANY QUESTIONS?

    And why men love Fox news.........along with the commentary.

    Have a great day.

  6. #81
    Veteran DarrinS's Avatar
    My Team
    San Antonio Spurs
    Join Date
    Jun 2005
    Post Count
    41,654
    So you found it interesting only because the conclusion agreed with what you think? I'm quite shocked by this. I wonder what you'll think of the papers that show why the conclusions reached in that paper are incorrect.

    Ok, here's another one.

    http://www.ecd.bnl.gov/steve/pubs/HeatCapacity.pdf

  7. #82
    e^(i*pi) + 1 = 0 MannyIsGod's Avatar
    My Team
    San Antonio Spurs
    Join Date
    Mar 2003
    Post Count
    57,479


    http://www.jamstec.go.jp/frsgc/resea...n_schwartz.pdf

    That was a critique of Schwartz's work. He reevaluated, and published this:

    http://www.ecd.bnl.gov/pubs/BNL-80226-2008-JA.pdf

    Which then brings him in line - albeit on the low side - with IPCC projections.

    1.1. Synopsis
    [1] Reanalysis of the autocorrelation of global mean
    surface temperature prompted by the several comments,
    taking into account a subannual autocorrelation of about
    0.4 year and bias in the autocorrelation resulting from the
    short duration of the time series has resulted in an upward
    revision of the climate system time constant determined by
    Schwartz [2007] by roughly 70%, to 8.5 ± 2.5 years (all
    uncertainties are 1-sigma estimates). This results in a like
    upward revision of the climate sensitivity determined in that
    paper, to 0.51 ± 0.26 K/(W m2), corresponding to an
    equilibrium temperature increase for doubled CO2 of 1.9 ±
    1.0 K, somewhat lower than the central estimate of the
    sensitivity given in the 2007 assessment report of the
    Intergovernmental Panel on Climate Change, but consistent
    within the uncertainties of both estimates. The conclusion
    that global mean surface temperature is in near equilibrium
    with the applied forcing continues to hold. Forcing over the
    twentieth century other than that due to greenhouse gases,
    ascribed mainly to tropospheric aerosols, is estimated as
    1.1 ± 0.7 W m2.
    Nice Darrin, use a paper that the scientist himself corrected after he was shown where he was incorrect to prove a point. This really disproves your conformation bias and instead shows how honestly interested you are in the science.
    Last edited by MannyIsGod; 08-17-2011 at 11:04 AM.

  8. #83
    selbstverständlich Agloco's Avatar
    My Team
    San Antonio Spurs
    Join Date
    Jan 2007
    Post Count
    9,013
    I won't apologize for making you think WC. I tend to do that to people and it pisses them off sometimes. Let's go through this step by step again.

    For what I have laid out, I am not attempting to quantify CO2. I am only showing that solar forcing is more than just the direct solar forcing. I do not accept the levels the prominent experts claim CO2 adds in radiative forcing. Not only are the high numbers used, but there is a wide range of numbers out there. A range of 9% to 26% of the greenhouse effect by CO2 is a pretty big range. Most certainly shows lack of certainty. The IPCC and other alarmists use the high percentage. I think it's only about 10% to 12%. , it may be even lower than the 9%. The 26% is simply insane.
    Ok.....you're attempting to show that solar forcing is more than just direct solar forcing. In the next breath you state:

    For what I have laid out, I am not attempting to quantify CO2. I am only showing that solar forcing is more than just the direct solar forcing. I do not accept the levels the prominent experts claim CO2 adds in radiative forcing. Not only are the high numbers used, but there is a wide range of numbers out there. A range of 9% to 26% of the greenhouse effect by CO2 is a pretty big range. Most certainly shows lack of certainty. The IPCC and other alarmists use the high percentage. I think it's only about 10% to 12%. , it may be even lower than the 9%. The 26% is simply insane.
    Now you've added another variable. You did this, not me. If you don't buy their models, it's necessary to either A) do some research and locate another or B) develop one of your own.

    Why do I say this? I'll use your own verbiage to illustrate why:

    If you agree or not with my entire rational of the above, do you at least agree the forcing for solar changes are greater than stated by the IPCC?
    The way temperature vs. radiative forcing is understood, this means they have to reduce some other factor.They give CO2 an increased forcing of 1.66 watts. This fits what I understand of CO2 forcing, reducing it to about 0.55 watts.
    So we have A) You not buying into the current CO2 models and B) You professing knowledge that said change must be due to some error in the calculation of solar changes vs assigning it to greenhouse gases.

    Trust one or the other? That would be because one or the other is wrong, and how do you really determine which? I have decided that because both solar and black carbon forcing are far greater than stated by the alarmists, that the forcing CO2 is said to have is incorrectly high. For my conclusion to be incorrect, then even the lowest accepted solar increases since then maunder Minima would have to be wrong.
    You're correct here. Even the smallest increases would need to be incorrect. How do we go about verifying such a thing though? Seems to me that dealing with the "problem" of CO2 concentration is an easier approach, and more appropriate I might add. We don't go around changing data to suit our needs. I did the thinking for you to this point.

    Then I made the mistake:

    You'd need to look at a Keeling curve or some other accepted CO2 tracking method to confirm your su ions. You can check if the forcing figures are accurate by doing two CO2 forcing calculations:

    One with your figures, one with theirs using CO2 concentration as the only "greenhouse variable". It's a log relationship, so the connection may not be immediately obvious. Choose your reference concentration wisely
    I asked you to perform a thought experiment (sorry). No a difficult one, just one in which deal with one variable (CO2) and see what gives with with respect to "solar changes". I asked you to, in effect create your own CO2 curve and verify that it doesn't match the one IPCC created using their data. If you can do that, you can say that there's "another factor in play".....irradiance unaccounted for. At that point, we'll most likely begin asking you to provide justification for your conclusion (the new CO2 levels). I get the distinct feeling that this is a path you don't feel like going down, hence your resistance.

    Even if your justification panned out, IMO that still wouldn't be sufficient evidence to assign it solely to "solar changes" (remember my question about climate variables and other greenhouse gases?)

    Bravo, you gave the IPCC curve:

    Now if I go by what the IPCC says, I get this from excel:

    But we have yet to see yours. You know, the one where you input your data and let us see where your CO2 concentration(s) lie(s).

    If you did that, it would be a start to demonstrating that there's an incongruency in the numbers (providing the equations you used and calculations would help immensely here also). You will have also created a tool (your own CO2 graph) with which to go about demonstrating that other factors may or may not be out of bounds as well.

    Finally:

    I wonder if I miss judged you. Let me ask in a simpler way. Do you agree that atmospheric heat will be proportional to solar heat with all other factors equal, or not?
    Apparently it wouldn't be the first error you committed.

    I wonder if I miss judged you. Let me ask in a simpler way. Do you agree that atmospheric heat will be proportional to solar heat with all other factors equal, or not?
    I think this is self evident. Unfortunately, this isn't the entire/most accurate representation of the reality of the situation. Proportionality is a given, the part you're missing is that the proportion is subject to change......possibly quite significantly due to other confounding variables. That's the entire thrust of the conversation above.

    Eliminate those variables one by one until you've shown that solar changes are the only (or predominant) mechanism by which climate change is effected........which leads us back to this:

    For what I have laid out, I am not attempting to quantify CO2.
    It's part of the demonstration unfortunately.

  9. #84
    Veteran Wild Cobra's Avatar
    My Team
    Portland Trailblazers
    Join Date
    May 2007
    Post Count
    43,117
    Agloco, I brought the simplified greenhouse effect chart with the changes up before. You seem unwilling like others to acknowledge that I have demonstrated that the feedback of the solar radiation has more power than the AGW crowd is willing to acknowledge.

    Looking it over again, I acknowledge I asked it poorly. With the way the greenhouse effect traps heat, it becomes more heat than the sun provides. What I was showing is that the 0,18% increase in heat is an increase of 0.12 watts of direct atmospheric heating and an increase of 0.30 watts to the surface. Because the feedback amplifies until the outgoing radiation equals the incoming radiation, these numbers stay very close to proportional.

    Do you agree or not that "IF" the change I assume, of a 0.18% increase, that the total increase in atmospheric radiative forcing also increases by 0.18%?

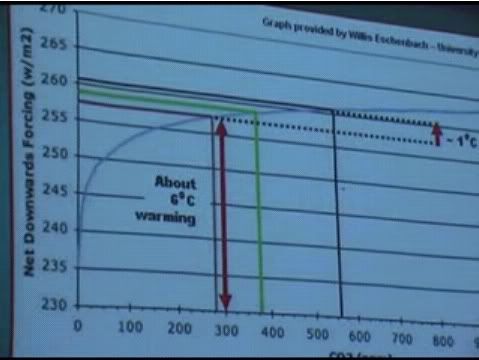
    When you say "In the next breath you state," you go on to something I stated in response to your questions, and this doesn't need to go that deep. I was considering all greenhouse gasses as the simple greenhouse effect diagram shows. Not knowing how much you know on the topic, I separated the CO2 for you, but have no desire to attempt to treat all greenhouse gasses individually. I don't have time to respond to so many tangents in this topic. But when you say "You will have also created a tool (your own CO2 graph)." I have tried very hard to use the AGW crowds own material. If you compare may graph to this:


    This is one some prominent Climatologist made, and Al Gore used I in his "Inconvenient Truth." Now the graph I made, using the IPCC formula listed in their material, is slightly higher in CO2 that this 2nd chart. This 2nd one shows 230 as the start for CO2, implying this is the separate number for CO2, and the other combined are 230. The CO2 levels appear to be about 27.5 watts (257.5-230) at just over 280 ppm, and 31 watts (261-230) at double the CO2. They are not exact, but they are close. At one time, I played with the variables in the forcing calculation to match that graph. I took a few minutes and found the excel file I generated that graph from. My 280 ppm level for CO2 calculates to 31.011 watts. The 379 ppm is 32.671, and a doubling to 560 is 34.814. the chart Al Gore used sows about a 3.5 watt increase for doubling and the IPCC shows a 3.803 watt increase.

    I don't know why I'm taking this time. I though I could keep this simple.

    If you don't buy their models, it's necessary to either A) do some research and locate another or B) develop one of your own.
    My stating I don't accept the levels is because solar forcing and BC forcing are both so much higher than used by the experts. This means something has to be adjusted. Their model is wrong. Either we have to increase one or more of the cooling variables, or decrease one or more of the the warming variables.
    You're correct here. Even the smallest increases would need to be incorrect. How do we go about verifying such a thing though? Seems to me that dealing with the "problem" of CO2 concentration is an easier approach, and more appropriate I might add. We don't go around changing data to suit our needs. I did the thinking for you to this point.
    Thing is, it's the CO2 that is very hard to quantify. Heat and watts are 100% interchangeable. When you consider conservation of mass and energy, it is the solar aspect we can easily quantify, and the remaining changes can then be attributed to other factors. I fail to see how you think CO2 is simpler. Please elaborate.

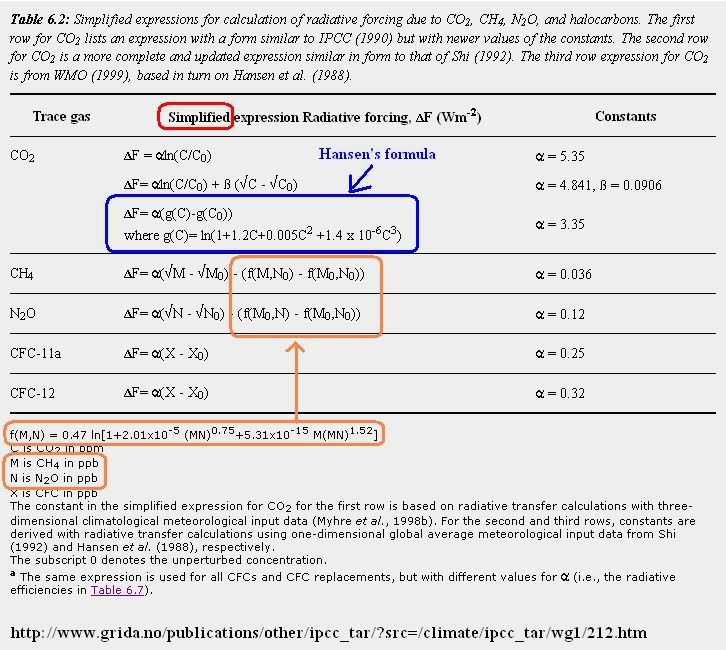
    As for the formulas, out of TAR (Third Assessment Report):


  10. #85
    e^(i*pi) + 1 = 0 MannyIsGod's Avatar
    My Team
    San Antonio Spurs
    Join Date
    Mar 2003
    Post Count
    57,479

    with the way the greenhouse effect traps heat, it becomes more heat than the sun provides.
    lloolololololololololololololololololololololololo ololololollloololololololololololololololololololo lololololoololololollloolololololololololololololo lolololololololololoololololollloololololololololo lololololololololololololololoololololollloolololo lolololololololololololololololololololoololololol lloolololololololololololololololololololololololo ololololollloololololololololololololololololololo lololololoololololollloolololololololololololololo lolololololololololoololololollloololololololololo lololololololololololololololoololololollloolololo lolololololololololololololololololololoololololol lloolololololololololololololololololololololololo ololololollloololololololololololololololololololo lololololoololololollloolololololololololololololo lolololololololololoololololollloololololololololo lololololololololololololololoololololollloolololo lolololololololololololololololololololoololololol lloolololololololololololololololololololololololo ololololollloololololololololololololololololololo lololololoololololollloolololololololololololololo lolololololololololoololololollloololololololololo lololololololololololololololoololololollloolololo lolololololololololololololololololololoololololol lloolololololololololololololololololololololololo ololololollloololololololololololololololololololo lololololoololololollloolololololololololololololo lolololololololololoololololollloololololololololo lololololololololololololololoololololollloolololo lolololololololololololololololololololoololololol lloolololololololololololololololololololololololo ololololollloololololololololololololololololololo lololololoololololollloolololololololololololololo lolololololololololoololololollloololololololololo lololololololololololololololoololololollloolololo lolololololololololololololololololololoololololol lloolololololololololololololololololololololololo ololololollloololololololololololololololololololo lololololoololololollloolololololololololololololo lolololololololololoololololollloololololololololo lololololololololololololololoololololollloolololo lolololololololololololololololololololoololololol lloolololololololololololololololololololololololo ololololollloololololololololololololololololololo lololololoololololollloolololololololololololololo lolololololololololoololololollloololololololololo lololololololololololololololoololololollloolololo lolololololololololololololololololololoololololol lloolololololololololololololololololololololololo ololololollloololololololololololololololololololo lololololoololololollloolololololololololololololo lolololololololololoololololollloololololololololo lololololololololololololololoololololollloolololo lolololololololololololololololololololoololololol lloolololololololololololololololololololololololo ololololollloololololololololololololololololololo lololololoololololollloolololololololololololololo lolololololololololoololololollloololololololololo lololololololololololololololoololololollloolololo lolololololololololololololololololololoololololol lloolololololololololololololololololololololololo ololololollloololololololololololololololololololo lololololoololololollloolololololololololololololo lolololololololololoololololollloololololololololo lololololololololololololololoololololollloolololo lolololololololololololololololololololoololololol lloolololololololololololololololololololololololo ololololollloololololololololololololololololololo lololololoololololollloolololololololololololololo lolololololololololoololololollloololololololololo lololololololololololololololoololololollloolololo lolololololololololololololololololololoololololol lloolololololololololololololololololololololololo ololololollloololololololololololololololololololo lololololoololololol
    lloolololololololololololololololololololololololo ololololol

  11. #86
    Veteran Wild Cobra's Avatar
    My Team
    Portland Trailblazers
    Join Date
    May 2007
    Post Count
    43,117
    Based on what, WC? Other than your own conformation bias, what makes qualified to say what the ranges should be? Where is your work? Show your calculations.
    I am not saying the range is 9-26%. that is what Climatologists say. I am using their numbers. As for showing the effect of solar forcing is greater than the direct forcing, it's flat out obvious. The indirect solar energy is why drives the surface IR that fuels the greenhouse effect, When you add more fuel, you get more feedback and even more heat.

    calculations are not necessary to understand a concept.
    Where does that added IR come from? You don't get to add the energy twice. Obviously the increased radiative forcing from the sun will cause heating at the surface but you don't somehow get to add that twice.
    To ask, means you don't understand the greenhouse effect. Having more heat value than supplied by the sun is already an accepted part of these sciences.
    If I give you 100 dollars and you turn around and spend 50 of that you don't get to say that you got another 50 dollars as change for a total of 150 dollars. That should be incredibly obvious.
    No, but if I put $100 a week in the bank, and don't take $100 a week out until four weeks later, then I have $400 sitting in the bank.
    It goes up and down each year for a very obvious reason. In a few months tell me how many of those green things that tend to use CO2 are still growing at the rate they are now. Given as most of the land - and therefore plant life - lies in the northern hemisphere it should be obvious why there is a seasonal variability.
    Well, plants frow faster in the summer and would consume more CO2 then. However, it is the summer that the CO2 values increase, and the winter when they decrease.

    I've explained the solubility of CO2 in water before. The colder the water, the more CO2 it hold to be in equilibrium.
    The Earth does not have a summer/winter cycle as you're trying to say it does, however. When those CO2 figures drop in the summer of the northern hemisphere, half of the globe is experiencing winter.
    Hint:

    That chart is taken from a science station at Mauna Loa, Hawaii. Does that explain it?
    He's asking you to do two calculations. One with your figures and one with their CO2 figures and try to see which one replicates the warming. Its the exact same thing I asked you for before because when you come up with a hypothesis it is required that you test it somehow. Seeing as you're arguing over variables in an equation you can easily plug in the other factors of that equation using data from the past and see how your results and the results of scientists who claim CO2 forcing is higher line up with reality.
    There is no need to do such a thing. A am asking for agreement or disagreement as to the individual solar effect.

  12. #87
    Veteran Wild Cobra's Avatar
    My Team
    Portland Trailblazers
    Join Date
    May 2007
    Post Count
    43,117
    lloolololololololololololololololololololololololo ololololollloololololololololololololololololololo lololololoololololollloolololololololololololololo lolololololololololoololololollloololololololololo lololololololololololololololoololololollloolololo lolololololololololololololololololololoololololol lloolololololololololololololololololololololololo ololololollloololololololololololololololololololo lololololoololololollloolololololololololololololo lolololololololololoololololollloololololololololo lololololololololololololololoololololollloolololo lolololololololololololololololololololoololololol lloolololololololololololololololololololololololo ololololollloololololololololololololololololololo lololololoololololollloolololololololololololololo lolololololololololoololololollloololololololololo lololololololololololololololoololololollloolololo lolololololololololololololololololololoololololol lloolololololololololololololololololololololololo ololololollloololololololololololololololololololo lololololoololololollloolololololololololololololo lolololololololololoololololollloololololololololo lololololololololololololololoololololollloolololo lolololololololololololololololololololoololololol lloolololololololololololololololololololololololo ololololollloololololololololololololololololololo lololololoololololollloolololololololololololololo lolololololololololoololololollloololololololololo lololololololololololololololoololololollloolololo lolololololololololololololololololololoololololol lloolololololololololololololololololololololololo ololololollloololololololololololololololololololo lololololoololololollloolololololololololololololo lolololololololololoololololollloololololololololo lololololololololololololololoololololollloolololo lolololololololololololololololololololoololololol lloolololololololololololololololololololololololo ololololollloololololololololololololololololololo lololololoololololollloolololololololololololololo lolololololololololoololololollloololololololololo lololololololololololololololoololololollloolololo lolololololololololololololololololololoololololol lloolololololololololololololololololololololololo ololololollloololololololololololololololololololo lololololoololololollloolololololololololololololo lolololololololololoololololollloololololololololo lololololololololololololololoololololollloolololo lolololololololololololololololololololoololololol lloolololololololololololololololololololololololo ololololollloololololololololololololololololololo lololololoololololollloolololololololololololololo lolololololololololoololololollloololololololololo lololololololololololololololoololololollloolololo lolololololololololololololololololololoololololol lloolololololololololololololololololololololololo ololololollloololololololololololololololololololo lololololoololololollloolololololololololololololo lolololololololololoololololollloololololololololo lololololololololololololololoololololollloolololo lolololololololololololololololololololoololololol lloolololololololololololololololololololololololo ololololollloololololololololololololololololololo lololololoololololollloolololololololololololololo lolololololololololoololololollloololololololololo lololololololololololololololoololololollloolololo lolololololololololololololololololololoololololol lloolololololololololololololololololololololololo ololololollloololololololololololololololololololo lololololoololololollloolololololololololololololo lolololololololololoololololollloololololololololo lololololololololololololololoololololollloolololo lolololololololololololololololololololoololololol lloolololololololololololololololololololololololo ololololollloololololololololololololololololololo lololololoololololol
    lloolololololololololololololololololololololololo ololololol
    OMG...

    You really don't understand, do you!

  13. #88
    e^(i*pi) + 1 = 0 MannyIsGod's Avatar
    My Team
    San Antonio Spurs
    Join Date
    Mar 2003
    Post Count
    57,479
    To ask, means you don't understand the greenhouse effect. Having more heat value than supplied by the sun is already an accepted part of these sciences.
    Holy .

    LOLOLOLOLOLOLOLOLOLOLOLOLOLOLOLOLOLOLOLOLOLOLOLOLO LOLOLOLOLOLOLOLOLOLOLOLOLOLOLOLOLOLOLOLOLOLOLOLOLO LOLOLOLOLOLOLOLOLOLOLOLOLOLOLOLOLOLOLOLOLOLOLOLOLO LOLOLOLOLOLOLOLOLOLOLOLOLOLOLOLOLOLOLOLOLOLOLOLOLO LOLOLOLOLOLOLOLOLOLOLOLOLOLOLOLOLOLOLOLOLOLOLOLOLO LOLOLOLOLOLOLOLOLOLOLOLOLOLOLOLOLOLOLOLOLOLOLOLOLO LOLOLOLOLOLOLOLOLOLOLOLOLOLOLOLOLOLOLOLOLOLOLOLOLO LOLOLOLOLOLOLOLOLOLOLOLOLOLOLOLOLOLOLOLOLOLOLOLOLO LOLOLOLOLOLOLOLOLOLOLOLOLOLOLOLOLOLOLOLOLOLOLOLOLO LOLOLOLOLOLOLOLOLOLOLOLOLOLOLOLOLOLOLOLOLOLOLOLOLO LOLOLOLOLOLOLOLOLOLOLOLOLOLOLOLOLOLOLOLOLOLOLOLOLO LOLOLOLOLOLOLOLOLOLOLOLOLOLOLOLOLOLOLOLOLOLOLOLOLO LOLOLOLOLOLOLOLOLOLOLOLOLOLOLOLOLOLOLOLOLOLOLOLOLO LOLOLOLOLOLOLOLOLOLOLOLOLOLOLOLOLOLOLOLOLOLOLOLOLO LOLOLOLOLOLOLOLOLOLOLOLOLOLOLOLOLOLOLOLOLOLOLOLOLO LOLOLOLOLOLOLOLOLOLOLOLOLOLOLOLOLOLOLOLOLOLOLOLOLO LOLOLOLOLOLOLOLOLOLOLOLOLOLOLOLOLOLOLOLOLOLOLOLOLO LOLOLOLOLOLOLOLOLOLOLOLOLOLOLOLOLOLOLOLOLOLOLOLOLO LOLOLOLOLOLOLOLOLOLOLOLOLOLOLOLOLOLOLOLOLOLOLOLOLO LOLOLOLOLOLOLOLOLOLOLOLOLOLOLOLOLOLOLOLOLOLOLOLOLO LOLOLOLOLOLOLOLOLOLOLOLOLOLOLOLOLOLOLOLOLOLOLOLOLO LOLOLOLOLOLOLOLOLOLOLOLOLOLOLOLOLOLOLOLOLOLOLOLOLO LOLOLOLOLOLOLOLOLOLOLOLOLOLOLOLOLOLOLOLOLOLOLOLOLO LOLOLOLOLOLOLOLOLOLOLOLOLOLOLOLOLOLOLOLOLOLOLOLOLO LOLOLOLOLOLOLOLOLOLOLOLOLOLOLOLOLOLOLOLOLOLOLOLOLO LOLOLOLOLOLOLOLOLOLOLOLOLOLOLOLOLOLOLOLOLOLOLOLOLO LOLOLOLOLOLOLOLOLOLOLOLOLOLOLOLOLOLOLOLOLOLOLOLOLO LOLOLOLOLOLOLOLOLOLOLOLOLOLOLOLOLOLOLOLOLOLOLOLOLO LOLOLOLOLOLOLOLOLOLOLOLOLOLOLOLOLOLOLOLOLOLOLOLOLO LOLOLOLOLOLOLOLOLOLOLOLOLOLOLOLOLOLOLOLOLOLOLOLOLO LOLOLOLOLOLOLOLOLOLOLOLOLOLOLOLOLOLO

  14. #89
    e^(i*pi) + 1 = 0 MannyIsGod's Avatar
    My Team
    San Antonio Spurs
    Join Date
    Mar 2003
    Post Count
    57,479
    Thermodynamics is rolling over in his grave right now.

  15. #90
    Veteran Wild Cobra's Avatar
    My Team
    Portland Trailblazers
    Join Date
    May 2007
    Post Count
    43,117
    Thermodynamics is rolling over in his grave right now.
    Explain then, how, when we only have an average 235 watt/square meter of incoming solar heat, why the energy value of the atmosphere is higher?

  16. #91
    e^(i*pi) + 1 = 0 MannyIsGod's Avatar
    My Team
    San Antonio Spurs
    Join Date
    Mar 2003
    Post Count
    57,479
    You understand the sciences so well that you don't know the difference between forcing and energy.

  17. #92
    Veteran Wild Cobra's Avatar
    My Team
    Portland Trailblazers
    Join Date
    May 2007
    Post Count
    43,117
    You understand the sciences so well that you don't know the difference between forcing and energy.
    Radiative forcing is generally used to express the net energy difference in the atmosphere. It doesn't have to be the net number though. Either way, watts are watts. Watts is a measurement of energy.

  18. #93
    e^(i*pi) + 1 = 0 MannyIsGod's Avatar
    My Team
    San Antonio Spurs
    Join Date
    Mar 2003
    Post Count
    57,479


    No - they are not.

    Fuzzy is going to have a field day with this.

  19. #94
    e^(i*pi) + 1 = 0 MannyIsGod's Avatar
    My Team
    San Antonio Spurs
    Join Date
    Mar 2003
    Post Count
    57,479
    I soooooooooooooooooooooooo get now what you're saying and I never would have had you not talked about things in this way. The sad thing is you were making such a huge fundamental error that I didn't even consider it.

    No, WC. The energy does not somehow grow on its way through the atmosphere and no AGW does not argue that in any way shape or form. The watts as measured in the diagram you mention are not all direct energy and are very different.

  20. #95
    Veteran Wild Cobra's Avatar
    My Team
    Portland Trailblazers
    Join Date
    May 2007
    Post Count
    43,117
    I soooooooooooooooooooooooo get now what you're saying and I never would have had you not talked about things in this way. The sad thing is you were making such a huge fundamental error that I didn't even consider it.

    No, WC. The energy does not somehow grow on its way through the atmosphere and no AGW does not argue that in any way shape or form. The watts as measured in the diagram you mention are not all direct energy and are very different.
    Bingo...

    As I was saying, it isn't all direct energy!

    Now think about my words again. I think you're starting to understand.
    Last edited by Wild Cobra; 08-18-2011 at 12:18 AM.

  21. #96
    e^(i*pi) + 1 = 0 MannyIsGod's Avatar
    My Team
    San Antonio Spurs
    Join Date
    Mar 2003
    Post Count
    57,479
    Oh I understand I gave you way too much credit which in itself is mind blowing because I don't give you much. The watts are NOT a measurement of energy but the measurement of how much energy it would take to cause equivlant heating.

  22. #97
    Veteran Wild Cobra's Avatar
    My Team
    Portland Trailblazers
    Join Date
    May 2007
    Post Count
    43,117
    Oh I understand I gave you way too much credit which in itself is mind blowing because I don't give you much. The watts are NOT a measurement of energy but the measurement of how much energy it would take to cause equivlant heating.
    Watts and heat are directly proportional. Watts and temperature doesn't have to be, and isn't in the case of climate science. That's why Climate Sensitivity comes in play between heat (watts) and temperature. It changes as the latent heat, and atmospheric mix changes.

    Why do you nitpick this when all I am doing is using the same references the Climate scientists use?

    Calling me wrong is the same as calling them wrong.

  23. #98
    e^(i*pi) + 1 = 0 MannyIsGod's Avatar
    My Team
    San Antonio Spurs
    Join Date
    Mar 2003
    Post Count
    57,479
    No reputable scientist would say anything like what you said above. No, the amount of energy or heat in the Earth's system is NOT more than the Sun puts out. Such foolishness.

  24. #99
    selbstverständlich Agloco's Avatar
    My Team
    San Antonio Spurs
    Join Date
    Jan 2007
    Post Count
    9,013
    Radiative forcing is generally used to express the net energy difference in the atmosphere. It doesn't have to be the net number though. Either way, watts are watts. Watts is a measurement of energy.
    I'll respond to your longer post later WC, I'm time limited at the moment. Here I just wanted to say that a watt is a measurement of energy conversion (power)......not simply energy. It may seem like a nit-pick, but it's an important distinction and I'll tie this into my response later.

    It seems to me that you want to keep using watts, energy and irradiance interchangeably. There are subtle yet important differences between them.

    PS - You'd better hope Fuzzy doesn't get ahold of this thread.

  25. #100
    Veteran DarrinS's Avatar
    My Team
    San Antonio Spurs
    Join Date
    Jun 2005
    Post Count
    41,654
    PS - You'd better hope Fuzzy doesn't get ahold of this thread.

    Why is that?

Thread Information

Users Browsing this Thread

There are currently 1 users browsing this thread. (0 members and 1 guests)

Posting Permissions

  • You may not post new threads
  • You may not post replies
  • You may not post attachments
  • You may not edit your posts
  •